
When we build a web application, one of our main concerns is to be able to cover it with tests as well as possible. Tests are essential to guarantee the correct functionality of our application at all times and Cypress is one of the tools that can help us in this respect.
Cypress could be described as a tool to automatically test anything in a web browser. It allows us to write different types of tests which are mainly needed for front-end development:
- E2E tests
- Integration tests
- Unit tests
Although it is completely agnostic of the technology stack used, it was developed with modern web applications in mind, which mainly use frameworks or libraries like React, Vue, Angular, etc. Furthermore, it is a free and open-source project.
Installing Cypress
Cypress can be easily installed in our project using npm (the default package manager for Node.js). If we already have npm in our local environment it will be enough to execute the following ‘npm install’ CLI command in the project’s root directory:
npm install cypress --save-dev
That will install Cypress locally as a dev dependency for our project. Then we will be able to see it reflected in our package.json file:
{
 "name": "our-project-name",
 ...
 "dependencies": {
   ...
 },
 "devDependencies": {
   "cypress": "7.7.0",
   ...
 },
}
When we install Cypress in our project we get two things:
- A CLI tool, which we will use to run Cypress both locally and in our CI environment.
- A desktop app that provides us with the UI that we will use in our day-to-day development.
Cypress CLI tool
The Cypress CLI tool provides us with two commands:
- ‘cypress open’, which allows us to open the Cypress UI.
- ‘cypress run’, which allows us to run the tests in a CI environment.
About Cypress running tests during the CI flow, we can highlight the following:
- The tests will be running in headless mode.
- Cypress will automatically take screenshots of all test runs out-of-the-box.
- Tests can be run in parallel.
Cypress UI
The Cypress user interface enables us to run our tests during the development stage. The main area of the view shows the list of all the test files (the so-called spec files) placed in our project. The structure displayed for those test files is mirroring the contents of the folders where we have located the spec files in our project. We can run one of these tests just by clicking it.
It is worth noting that we can also select the browser we want to use to run the tests via a drop-down menu in the top right-hand corner.
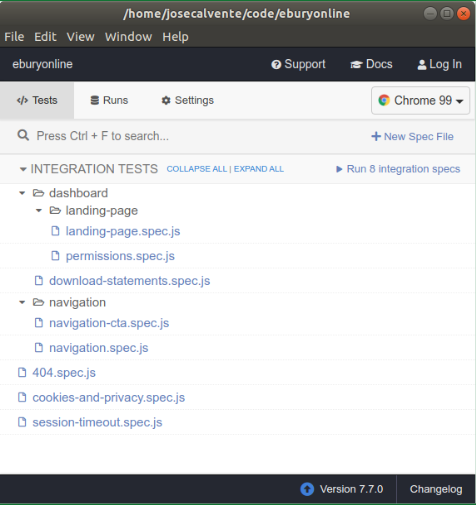
When a test file is executed, Cypress will bring up a full version of the selected web browser, and all tests defined within the file will be executed sequentially there.
The view that is opened in the browser is split into two well-differentiated parts:
- On the right-hand side, we will have our web application running within an iframe.
- On the left-hand side, we will have the so-called Cypress command log, showing every single test within our spec file.
On top of this we have general information about how many tests ran successfully, how many failed, and the time it took to run all the tests.
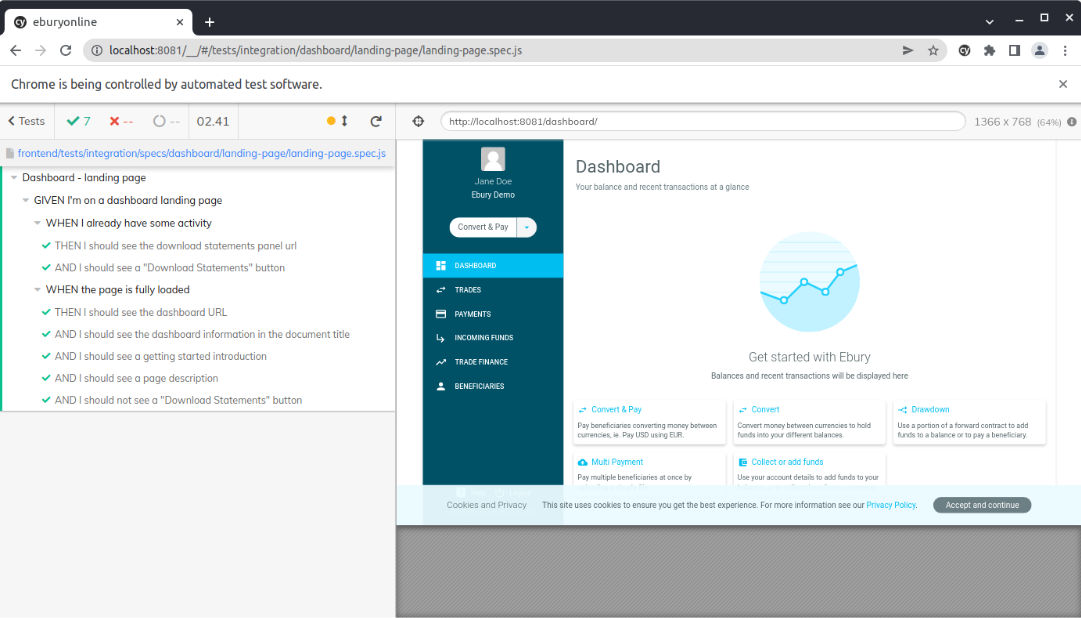
We can expand each test section by clicking on it, and thus see every single action which took place within that specific test.
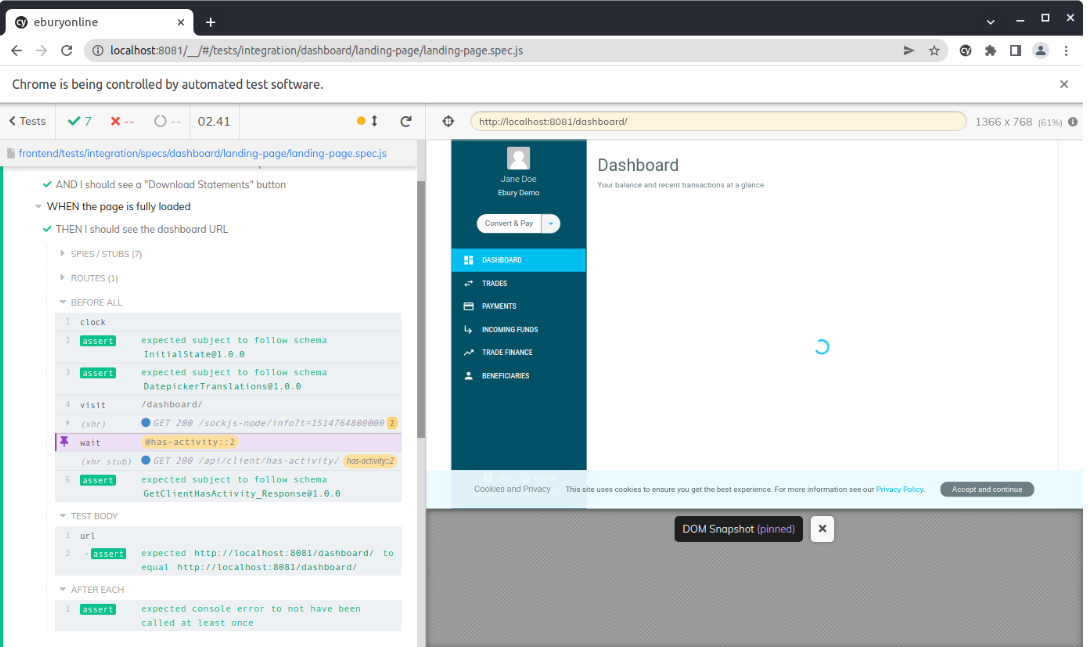
The most important feature offered by the Cypress command log is that it gives us the ability to time travel through our tests. This is possible because screenshots are taken after each action. When we select any of the actions which have been executed in the Cypress command log, the corresponding screenshot is displayed. In this way, we can see the status of our application at any time we want, which makes this tool one of our best friends in debugging tasks.
Integration tests
As mentioned before, Cypress enables us to create different types of front-end tests. We are going to focus specifically on integration tests.
When we work with integration tests, we don’t really want to connect to the actual API endpoints of our backend system. Instead, we would like to have predefined datasets which allow us to represent different scenarios for our application. Not only for the happy path, in which everything happens as expected, but also for possible error scenarios, to check that the application offers useful and well-displayed information to the user. Or even scenarios in which the client is waiting to receive the requested information, to see how it would display that state to the user. To achieve this we make use of so-called ‘fixtures’.
Fixtures are files containing fixed data sets. Cypress provides us with commands which enable us to intercept requests and inject these fixtures as responses. In this way, we are able to represent and cover any possible scenario, which might be presented to our users, with tests.
Set-up
Given that Cypress is executed in the same run loop as our application, it is essential that our web application is running. So the first step, even before launching the UI of the tool, will be to start our web application.
The next step is to define the ‘cypress.json’ file, where we can set up the necessary configuration for the execution of the tests. Through this file we will be able to indicate, among other things, the URL where Cypress will be able to connect to our application, the file name pattern the test files to be executed must comply with, the folders where it will find the spec and fixtures files, and the folder where the screenshots taken must be stored.
{
 "baseUrl": "http://localhost:8081",
 "testFiles": "**/*.spec.js",
 "integrationFolder": "frontend/tests/integration/specs/",
 "screenshotsFolder": "frontend/tests/integration/screenshots/",
 "fixturesFolder": "frontend/tests/integration/fixtures/",
 ...
}
Once the web application is running and we have our configuration file properly defined, we can start the Cypress UI. To be able to use our custom configuration file, simply setting its path as an option when we run the command:
cypress open --config-file frontend/tests/integration/cypress.json
BDD syntax
Cypress has adopted Mocha’s BDD (Behaviour-driven development) syntax (link). In a nutshell, test cases are written in a natural language that even non-programmers can read.
This BDD interface provides the functions which we use to structure our tests:
- The ‘describe()’ and ‘context()’ functions simply allow us to organise our tests and make them easier to read, so that they give us context for the scenario being simulated. ‘context()’ is just an alias for ‘describe()’.
- The function ‘it()’ will contain our test case itself. Inside we will set the actions we want to test along with the assertions that validate them.
- We also have the hooks ‘before()’, ‘after()’, ‘beforeEach()’, and ‘afterEach()’ available. They enable us to set up preconditions before running the tests and to clean them up after the tests. ‘before()’ and ‘after()’ run once before the first test and after the last test respectively in the block where they are placed. On the other hand, ‘beforeEach()’ and ‘afterEach()’ run before and after each test in the block where they are placed.
- In addition to all of that, it also provides us with a couple of exclusivity functions which allow us to determine which of the defined tests will be executed. On the one hand, we can indicate that we want to run exclusively a test-case or a suite of them by appending ‘.only()’ to the relevant function. On the other hand, by appending ‘.skip()’ we can indicate that we want to ignore one or more test-cases.
describe('GIVEN I am on a landing page', () => {
  context.only('WHEN the page is fully loaded', () => {

    before(() => {
      // runs once before the first test in this block
    });

    after(() => {
      // runs once after the last test in this block
    });

    beforeEach(() => {
      // runs before each test in this block
    });

    afterEach(() => {
      // runs after each test in this block
    });

    it('THEN I should see a title', () => {
      // test case - It will be run
    });

    it.skip('AND I should see a submit button', () => {
      // another test case - It will be skipped
    });
  });
});
Visiting pages
To check the correct behaviour of our web application we first need to open the page that is the subject of our tests. This is what the ‘visit’ command offers us. If we have set the ‘baseUrl’ option in the configuration file, Cypress will prefix the URL we pass as a parameter with the value set in the ‘baseUrl’.
A second parameter allows us to complement the request with options such as setting a timeout, defining an HTTP method to use, or setting hooks to be invoked before and/or after the page has loaded all of its resources.
cy.visit('/dashboard/', {
  method: 'GET',
  timeout: 30000,
  onBeforeLoad: (contentWindow) => {
    // contentWindow is the page's window object
  },
})
Stubbing responses
This is the part that could be considered the most specific part of the integration tests only, since it is where we are going to replace the answers that our backend would provide with the dummy answers that we have predefined in the fixture files. However, it could also be interesting for E2E in cases where we have third-party libraries, and we want to mock their behaviour instead of having those real libraries being covered by our tests.
This functionality is based on the combination of the commands ‘server’, ‘route’, and ‘wait’.
- server – start a server to begin routing responses to ‘route’ and to change the behaviour of network requests. We can pass as an optional parameter that will define its behaviour, such as a delay for stubbed responses, or the response status code when stubbing routes.
- route – manage the behaviour of network requests. Broadly speaking, it allows us to define a URL, an HTTP method, and a response. When the conditions are met that the specified URL has been invoked using the specified HTTP method, then the request will be intercepted and the specified response will be returned. Although the response can be hardcoded, normally these responses are the ones we have defined in our fixtures.
It is important to note that the requests we want to mock must be defined correctly through the ‘route’ command, since any request that does not match will be passed through the real server instead of being intercepted. - wait – enter a wait for a specified number of milliseconds or until an aliased resource is resolved before continuing to the next command. Using the ‘as’ command we can alias the routing we defined by using ‘route’, which means that we are able to introduce a wait until our stubbed request is invoked and then resolved.
This can be seen easier with an example. Imagine that we want to define a simple test-case which checks if, once we have navigated to a page of our web application (a dashboard, for example), the URL is as expected. In turn, let’s imagine that when our application loads that page it has to fetch the user’s profile information from the server. If we want to achieve that when this request is made, instead of going to our backend, the response is the one we have predefined in a certain fixture, we can proceed as follows:
context('GIVEN I am on a dashboard landing page', () => {
 const DASHBOARD_URL = '/dashboard/';

 before(() => {
   cy.server();

   cy.route('GET', '/api/user/profile/', 'fx:api/user/profile/default.json')
     .as('getUserProfileRequestId');

   cy.visit(DASHBOARD_URL);

   cy.wait('@getUserProfileRequestId')
 });

 it('THEN I should see the dashboard URL', () => {
   cy.url()
     // `should` is the command used by Cypress to create an assertion
     .should('eq', `${Cypress.config('baseUrl')}${DASHBOARD_URL}`);
 });
});
Commands
Apart from those seen above, the Cypress API includes an extensive list of commands to cover a huge number of needs.
To highlight some of the ones you are likely to use most often:
- get – get one or more DOM elements e.g. cy.get(‘.dashboard__title’)
- find – get the descendent DOM elements of a specific selector. Ideal for use in conjunction with the get command e.g. cy.get(‘.main-table’).find(‘footer’)
- contains – get the DOM element containing the text e.g. cy.get(‘.label__name’).contains(‘Name’)
- eq – get a DOM element at a specific index in an array of elements e.g. cy.get(‘ul>li’).eq(4)
- filter – get the DOM element that match a specific selector e.g. cy.get(‘td’).filter(‘.active’)
- not – exclude DOM elements from a set of them e.g. cy.get(‘td’).not(‘.active’)
- url – get the current URL of the page e.g. cy.url()
- should – create an assertion e.g. cy.get(‘.error’).should(‘be.empty’)
- trigger – trigger an event oa a DOM element e.g. cy.get(‘a’).trigger(‘mousedown’)
- click – click a DOM element e.g. cy.get(‘.btn’).click()
- type – type into a DOM element e.g. cy.get(‘input’).type(‘Hello, World’)
- clear – clear the value of an input or textarea e.g. cy.get(‘input’).clear()
- check – check checkboxes or radios e.g. cy.get(‘[type=”checkbox”]’).check()
- select – select an <option> within a <select> e.g. cy.get(‘select’).select(‘user-1’)
Custom commands
Cypress also offers the possibility to easily create custom commands, or override the behavior of existing ones.
// Cypress.Commands.add(name, callbackFn)
// Cypress.Commands.add(name, options, callbackFn)
Cypress.Commands.add('login', (email, pw) => {})

// Cypress.Commands.overwrite(name, callbackFn)
Cypress.Commands.overwrite('visit', (orig, url, options) => {})