We love building great products, but a product would be completely useless if it is not properly designed for the people who are meant to use it. This lack of efficiency impacts the user experience (UX) of the solution. But, how can we achieve a good UX when developing a product? Is there a way that we can measure user performance objectively?
By trying to answer these questions, we realised there aren’t any cheap and easy-to-use tools ready for any member of our team. So, since we have some experience in things like building software, we decided to develop our own tool.
We are glad to introduce huha.js, a Javascript framework that is intended to measure the usability and user experience in an automated way, considering the limitations of the model and best practices.
In this post, we would like to share how it was built, in order to get fast and detailed feedback on user experience and be able to provide support to a highly iterative agile development practice.
Measuring user performance
We needed a way to be ahead of customer feedback and understand how the actual user behaviour is impacted after the solution is applied. We asked ourselves “how can we collect information about what our customers are doing when they try to achieve a goal?”
We started simple and began by defining a model that will represent how users interact with products based on Tasks. A Task is a minimal activity that a user does when using an application, like logging in, creating an item, searching or filtering data.
The model will be implemented with Javascript, since it will allow us to integrate it easily with any of our projects built with web technologies. So far, we just need a class with a name that will represent our tasks.
class Task {
  constructor(name) {
    this.name = name;
  }
}
Easy peasy, right? Let’s make this task more useful. Our goal is to include more metrics that will help us to understand the user performance.
Result
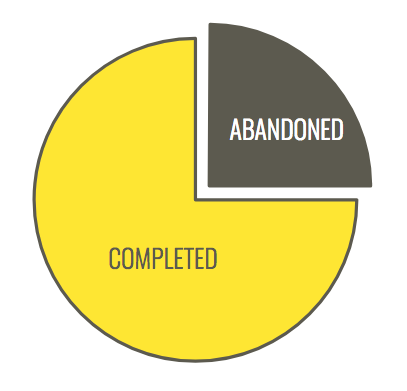
Our first metric is going to be the result of the task. A task can have two different results: completed or abandoned. If the user completes the task with success, it’s labeled as “completed”. If the user doesn’t go through the task completely, then it’s marked as “abandoned”.
In the code, we have a third label, used when the task is in progress, so the result is currently unknown.
const IN_PROGRESS = 'In progress';
const COMPLETED = 'Completed';
const ABANDONED = 'Abandoned';

class Task {
  constructor(name) {
    // ...
    this.result = IN_PROGRESS;
  }

  complete() {
    this.result = COMPLETED;
  }

  abandon() {
    this.result = ABANDONED;
  }
}
We will execute the “complete” and the “abandon” methods whenever we consider the task is finished. The applications integrated with the tool are responsible for changing the result of the task. This offers great flexibility while keeping things simple (we love the KISS principle!).
Interactions
Usually, the most efficient UI is the one that doesn’t require many interactions from the users. Therefore, we’ll try to have the number of interactions as minimum as possible without affecting other metrics.
This effort is quantified as a number in the task, which is initialised to zero. That value is increased whenever we consider there is an interaction.
class Task {
  constructor(name) {
    // ...
    this.effort = 0;
  }

  addInteraction() {
    this.effort += 1;
  }
}
Again, as we wanted a flexible tool, we offer a method for adding an interaction that needs to be executed by the application including this tool. This is normally triggered every time the user performs a click, a keystroke or gets an input focus.
Errors
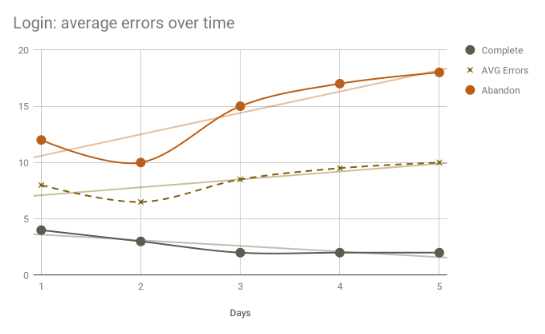
Another metric we wanted to measure and, keep as low as possible, is the number of errors that users make during the execution of a task. This is because a user who encounters many errors trying to achieve something is likely to become frustrated, increasing the chances of them abandoning the task altogether.
Like the effort, errors are modelled as a number.
class Task {
  constructor(name) {
    // ...
    this.errors = 0;
  }

  addError() {
    this.errors += 1;
  }
}
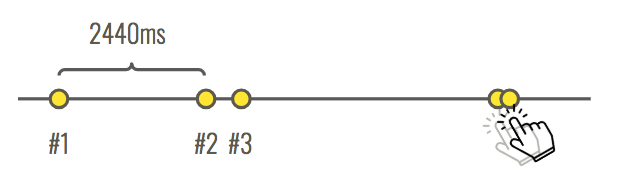
Time
Finally, the last metric we are going to collect is the time that the user needs to finish a task. We don’t want our users spending too much time on tasks if that is the result of more effort or errors.
In order to record that time, we are going to store when the task started and when it finished. So the time spent on a task will be the difference between these two date times.
class Task {
  constructor(name) {
    // ...
    this.start = new Date();
    this.end = null;
  }

  get time() {
    return this.end - this.start;
  }

  finish(result) {
    this.result = result;
    this.end = new Date();
  }

  complete() {
    this.finish(COMPLETED);
  }

  abandon() {
    this.finish(ABANDONED);
  }
}
A real example
Now that we have everything we need to start measuring how the users use the applications, let’s apply it to a real example: a login page.
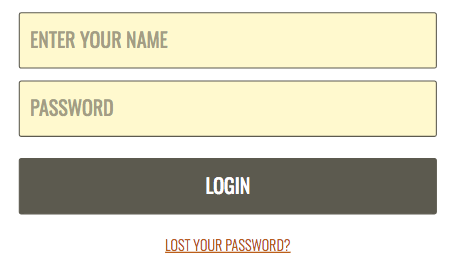
Our definition of the task will be the following:
- Result: Completed when clicking on the “Login” button and after entering an username and password. Abandoned when clicking on the “Lost your password?” link.
- Interactions: They are incremented every time the user focuses on one of the inputs or clicks on either the “Login” button or the “Lost your password?” link.
- Errors: Increased whenever the user tries to login without entering a username or password.
Keep in mind that this doesn’t need to be the only way to be authenticated in an application, so we could potentially define different “login” tasks. Besides, a “successful” login is not when the user clicks on the login button but when the server authenticates the user, but in order to have a simple example we are assuming that just clicking on the “Login” button is enough.
HTML
<form>
  <input type="text" id="user">
  <input type="password" id="pass">
  <button type="button" id="login">Login</button>
  <a href="#" id="forgot">Lost your password?</a>
</form>
Javascript
const task = new Task('Login');
console.log(task.name); // Login
console.log(task.result); // In progress

const user = document.querySelector('#user');
const pass = document.querySelector('#pass');
const login = document.querySelector('#login');
const forgot = document.querySelector('#forgot');

login.addEventListener('click', () => {
  task.addInteraction();
  if (user.value && pass.value) {
    task.complete();
    console.log(task.result); // Completed
  } else {
    task.addError();
  }
}

forgot.addEventListener('click', () => {
  task.addInteraction();
  task.abandon();
  console.log(task.result); // Abandoned
}

user.addEventListener('focus', () => {
  task.addInteraction();
}

pass.addEventListener('focus', () => {
  task.addInteraction();
}
Tracking the metrics
So, we already know how to get all the different metrics but there is one important thing missing. How can we analyse them in order to make changes??
There are different approaches we can follow: 1) store all the data directly in a database (our own database or a cloud one like Firebase) and perform queries against it or 2) use a third party tool that already provides the analysis part (such as Google Analytics, Intercom or Segment).
Due to its ease of use, and because we were already using it in our projects, the first tracker we’ve added to our library is Google Analytics. We send three different events for storing the time on task, the effort and the errors. The result is indicated in all of them so we can then compare the different results.
class Task {
  // ...
  finish(status) {
    // ...
    this.track();
  }

  track() {
    gtag('event', 'timing_complete', {
      event_category: this.name,
      event_label: 'Time on task',
      value: this.time,
      name: this.result,
    });
    gtag('event', this.result, {
      event_category: this.name,
      event_label: 'Error',
      value: this.errors,
    });
    gtag('event', this.result, {
      event_category: this.name,
      event_label: 'Effort',
      value: this.effort,
    });
  }
}
Open source library: huha.js
As mentioned previously, we implemented and released huha.js, a Javascript library that is intended to measure user experience automatically based on the concepts explained on this post.
If you want to have a look at both the code and the documentation, you can check out the repository on Github. As an open source project, we are happy to receive contributions from the community!
Our context: we are agile
Before wrapping up, it is important to understand the context of the problem, how it originated and why usability is so relevant for our products.
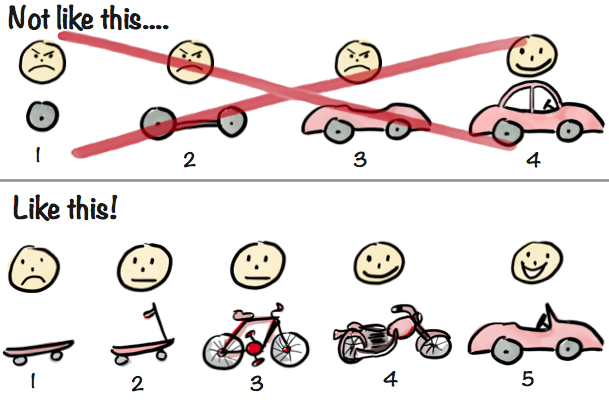
We are applying an agile methodology. This means that we want to validate every new feature we launch as soon as possible. We release these features in small iterations, then we gather feedback from our customers to validate their usability and define new improvements according to the feedback.
One of the aspects that is going to affect those features most, and our customer’s feedback, is their experience with the solution. If clients don’t know how to use our products, or if they spend a long time trying to achieve a goal, their feedback will probably be negative and we would need to spend more time developing and improving the usability.